
This post was written by Ashish Tomar.
A tree or hierarchical representation of data is commonly observed in biology. This is due to interlinked information, and the complex hierarchical nature of biological systems. Advanced data visualization in scientific communities is becoming a trend to help researchers discover hidden pattern in such systems.
The aim of my project was to create novel, innovative and interactive visualization of hierarchical data in biology. My work depends heavily on JavaScript and D3.js library, which allow document data manipulation and help create powerful visualization. D3.js gives a layout for hierarchical data visualization, providing functionality to create multiple types space filling and node link diagrams.
During my secondments to the Natural History Museums in Stockholm and Copenhagen, BIG4 supervisors Fredrik and Alexey helped me narrow down exact biological problems that could be addressed through visualization. The main outcome of my project is the Danish Beetle Atlas visual interface and Taxonomy tree editor web application. The Danish Beetle Atlas is a visualization rich project as the beetle occurrence data are very rich and have multiple dimensions to get visual insight.
The taxonomy tree editor application is the most interesting work as currently there is no tool that can help researchers edit and compare two taxonomies. It is also the most challenging work as large taxonomy data files are heavy to handle on client side. An interesting feature is that the user can "drag and drop" a node from a reference taxonomy to working taxonomy.
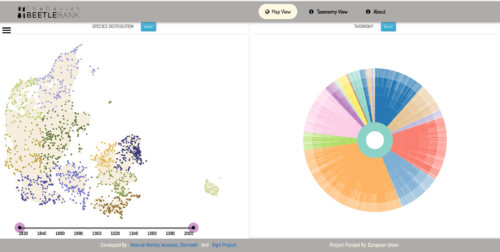
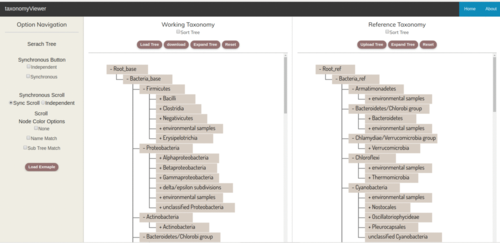
Figure 2: Taxonomy Editor for visual editing of taxonomy trees in the web browser
Description of my additional visualization projects:
-
Phylogenomics tree visualization library: A JavaScript library using D3.js for integrative visualization of phylogenetic tree along with metadata in web browser.
-
Metagenomics visualization: A hierarchical data visualization prototype web application to help the user to view multiple data samples with synchronous interaction.
-
Geo-coordinates spatial data visualization: A web app to map biodiversity geo-coordinates to the geographical location.
-
Metabarcoding visualization: A prototype visualization for comparative analysis of multiple metabarcoding data.
I am glad to be part of such an amazing group, which is working in basic biology to advance data science. This project helped me explore the visual dimension of biology. It also made me realize how important biodiversity and ecology is for our planet and what we can do using the advancement of technology. I recently developed a hobby of taking photos of wild flowering plants and love for butterflies.
I would like to thank all people from BIG4 for the wonderful discussions and for helping me out in difficult situations. I would also like to thank EU Horizon2020 for supporting this project and providing a research environment where a researcher can pursue their passion and contribute to the betterment of society.